

Ethereum bullish divergence breakout patterns emerge across multiple timeframes. After weeks of consolidation and market uncertainty, Ethereum (ETH) has confirmed a hidden bullish divergence that technical analysts believe could propel the second-largest cryptocurrency toward the critical $4,811 resistance level.
This Ethereum bullish divergence breakout represents more than just a temporary price spike – it signals a potential shift in market sentiment that could establish new bullish momentum for the broader altcoin ecosystem. As institutional investors and retail traders closely monitor these technical developments, the mechanics behind this divergence pattern becomes crucial for making informed investment decisions.
The confirmation of this hidden bullish divergence comes at a time when Ethereum faces multiple catalysts, including network upgrades, increased institutional adoption, and growing demand for decentralized finance (DeFi) applications. These fundamental factors, combined with the technical breakout pattern, create a compelling narrative for ETH’s potential recovery toward previous highs.
The Hidden Bullish Divergence Pattern in Ethereum
Hidden bullish divergences represent one of the most reliable technical indicators for predicting price reversals in cryptocurrency markets. Unlike regular bullish divergences that occur during downtrends, hidden Ethereum bullish divergence breakout patterns emerge during uptrends, suggesting that the underlying bullish momentum remains intact despite temporary price corrections.
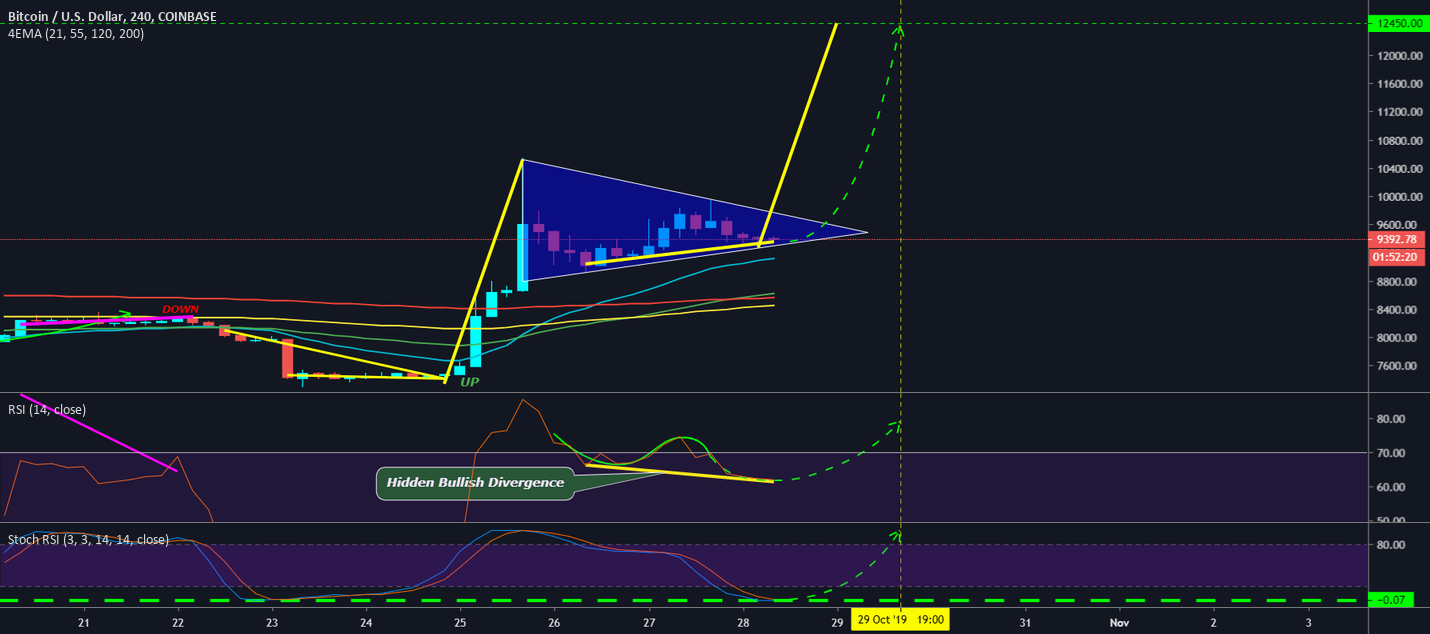
In Ethereum’s case, this pattern manifested when price action created lower highs while technical oscillators like the Relative Strength Index (RSI) and Moving Average Convergence Divergence (MACD) formed higher lows. This discrepancy between price movement and momentum indicators typically signals that selling pressure is weakening and buyers are beginning to regain control.
Key Technical Indicators Supporting the Breakout
Several technical indicators have aligned to confirm the Ethereum bullish divergence breakout:
Volume Analysis: Trading volume has increased significantly during the breakout phase, indicating genuine buying interest rather than a false breakout. This volume confirmation adds credibility to the bullish divergence signal.
Moving Average Support: Ethereum has successfully reclaimed key moving averages, including the 50-day and 100-day exponential moving averages. This reclaim suggests that the medium-term trend structure is shifting from bearish to bullish.
RSI Momentum: The Relative Strength Index has broken above the descending trendline that previously capped bullish momentum, indicating that momentum is shifting in favor of buyers.
Technical Analysis The Path to $4,811
The Ethereum bullish divergence breakout has established a clear technical framework for ETH’s potential price trajectory toward the $4,811 target. This price level represents a significant resistance zone that previously acted as support during Ethereum’s bull run phases.
Fibonacci Retracement Levels
Technical analysts have identified several key Fibonacci retracement levels that could influence Ethereum’s journey toward $4,811:
The 38.2% retracement level at approximately $3,200 has already been surpassed, confirming the strength of the Ethereum bullish divergence breakout. The next significant resistance appears at the 50% retracement level around $3,800, which aligns with previous consolidation zones.
The 61.8% Fibonacci level, often considered the “golden ratio” in technical analysis, sits near $4,200. Breaking above this level would provide strong confirmation that the bullish divergence breakout has sufficient momentum to reach the ultimate $4,811 target.
Support and Resistance Structure
The current market structure shows that Ethereum has established a solid foundation of support levels that could sustain the Ethereum bullish divergence breakout:
Primary Support Zone: $2,800 – $3,000 represents the primary support zone where significant buying interest emerged during the initial breakout phase.
Secondary Support: The $3,200 level, which previously acted as resistance, has now transformed into support, demonstrating the classic technical principle of “resistance becoming support.”
Target Resistance: The $4,811 level represents the ultimate target for this breakout pattern, coinciding with previous significant highs and representing a psychological barrier for market participants.
Market Dynamics Driving the Ethereum Bullish Divergence Breakout

Beyond technical analysis, several fundamental factors contribute to the strength of the Ethereum bullish divergence breakout. these underlying market dynamics provides context for why this technical pattern has emerged and why it might succeed in reaching the $4,811 target.
Institutional Adoption Trends
The growing institutional interest in Ethereum has created sustained buying pressure that supports the technical breakout pattern. Major corporations, hedge funds, and investment firms have increased their Ethereum allocations, viewing the network’s smart contract capabilities and decentralized application ecosystem as valuable long-term investments.
Recent data shows that institutional Ethereum holdings have reached all-time highs, with many institutions using price dips as accumulation opportunities. This institutional backing provides a fundamental foundation for the Ethereum bullish divergence breakout to maintain momentum toward higher price targets.
Network Upgrade Catalysts
Ethereum’s ongoing network improvements and upgrades continue to attract investor attention and support the bullish technical outlook. The successful implementation of various Ethereum Improvement Proposals (EIPs) has enhanced network efficiency, reduced transaction costs, and improved user experience.
These technical improvements translate into increased network usage, higher transaction volumes, and greater demand for ETH tokens. The combination of technical network improvements and the Ethereum bullish divergence breakout pattern creates a synergistic effect that could accelerate price appreciation.
DeFi and NFT Market Impact on Ethereum Price Action
The decentralized finance (DeFi) ecosystem and non-fungible token (NFT) markets continue to drive significant demand for Ethereum, providing fundamental support for the Ethereum bullish divergence breakout pattern.
DeFi Total Value Locked Growth
Total Value Locked (TVL) in DeFi protocols has shown remarkable resilience and growth, with Ethereum maintaining its position as the dominant blockchain for DeFi applications. This sustained DeFi activity creates consistent demand for ETH tokens, as users need Ethereum to pay transaction fees and participate in various protocols.
The correlation between DeFi growth and Ethereum price appreciation has historically been strong, suggesting that the current Ethereum bullish divergence breakout could benefit from continued DeFi ecosystem expansion.
NFT Market Renaissance
The NFT market has experienced renewed interest and activity, with major collections and platforms choosing Ethereum as their primary blockchain. This preference for Ethereum-based NFTs creates additional demand for ETH tokens and supports the overall bullish narrative.
High-profile NFT sales and celebrity endorsements continue to drive mainstream attention to the Ethereum ecosystem, potentially attracting new investors who could contribute to the success of the Ethereum bullish divergence breakout.
Regulatory Landscape
The evolving regulatory environment for cryptocurrencies remains a significant consideration for Ethereum’s price trajectory. Regulatory clarity or restrictions could influence market sentiment and impact the Ethereum bullish divergence breakout pattern.
Recent regulatory developments in major markets have generally been supportive of blockchain technology and cryptocurrencies, but ongoing regulatory evolution requires constant monitoring by investors and traders.
Also Read: Ethereum Price Analysis Key Support and Resistance Levels
Trading Strategies for the Ethereum Bullish Divergence Breakout
Professional traders and investors can implement various strategies to potentially benefit from the Ethereum bullish divergence breakout while managing associated risks.
Position Management Approaches
Dollar-Cost Averaging: Implementing a systematic accumulation strategy during the breakout phase can help investors build positions while managing timing risk. This approach is particularly effective during the early stages of a Ethereum bullish divergence breakout.
Swing Trading: Active traders can capitalize on intermediate price movements within the broader bullish trend, using technical support and resistance levels to guide entry and exit decisions.
Long-Term Holding: Investors with longer time horizons can use the Ethereum bullish divergence breakout as an opportunity to establish strategic positions targeting the $4,811 level and beyond.
Risk Management Techniques
Effective risk management remains crucial when trading the Ethereum bullish divergence breakout. Setting appropriate stop-loss levels, position sizing, and profit-taking strategies can help preserve capital while maximizing potential returns.
Stop-loss levels should be positioned below key support zones, particularly the $2,800-$3,000 range that provided the initial foundation for the breakout pattern. This approach helps protect against false breakouts while allowing sufficient room for normal price volatility.
Market Sentiment and Social Media Analysis
Social media sentiment and community engagement metrics provide additional insights into the strength and sustainability of the Ethereum bullish divergence breakout. Monitoring these sentiment indicators can help investors gauge market psychology and potential continuation patterns.
Community Engagement Metrics
Ethereum community engagement across social media platforms has increased significantly during the breakout phase, with positive sentiment dominating discussions. This positive sentiment supports the technical pattern and suggests that retail investor interest is aligning with the Ethereum bullish divergence breakout.
Developer activity and ecosystem growth metrics also show positive trends, indicating that the fundamental value proposition of Ethereum continues to strengthen alongside the technical breakout pattern.
Institutional Sentiment Indicators
Institutional sentiment indicators, including futures positioning, options flow, and institutional custody data, show increasing institutional confidence in Ethereum’s long-term prospects. This institutional support provides additional validation for the Ethereum bullish divergence breakout pattern.
Comparative Analysis with Previous Breakout Patterns
Historical analysis of previous Ethereum bullish divergence breakout patterns provides valuable insights into potential price targets and timeline expectations for the current breakout attempt.
Historical Performance Data
Previous hidden bullish divergence patterns in Ethereum have typically resulted in significant price appreciation, with many breakouts achieving their projected targets within 60-90 days. The current pattern shows similar characteristics to successful historical breakouts, suggesting potential for similar performance.
Comparison with previous bull market phases shows that Ethereum often experiences accelerated price appreciation once key resistance levels are broken, supporting the bullish case for reaching the $4,811 target.
Pattern Recognition and Validation
Technical pattern recognition algorithms and machine learning models show high confidence levels in the current Ethereum bullish divergence breakout pattern. These quantitative validation methods provide additional support for the bullish technical outlook.
The combination of traditional technical analysis and modern algorithmic validation creates a comprehensive framework for understanding the potential success of the current breakout pattern.
Future Outlook and Price Projections
Looking beyond the immediate $4,811 target, the successful completion of the Ethereum bullish divergence breakout could establish the foundation for even higher price objectives in subsequent market phases.
Extended Price Targets
If Ethereum successfully reaches and consolidates above $4,811, technical analysts project potential targets extending toward previous all-time high levels and potentially beyond. These extended targets would depend on maintaining the bullish momentum established by the current breakout pattern.
The achievement of the $4,811 target would also likely trigger increased institutional and retail investor interest, potentially creating a feedback loop that supports continued price appreciation.
Market Cycle Considerations
Ethereum’s position within broader cryptocurrency market cycles provides context for evaluating the long-term implications of the Ethereum bullish divergence breakout. Current market conditions suggest that Ethereum may be entering a new bullish phase that could extend well beyond the immediate technical targets.
Conclusion
The confirmation of the Ethereum bullish divergence breakout represents a significant technical development that positions ETH for potential recovery toward the $4,811 target. This breakout pattern, supported by strong volume, institutional adoption, and fundamental network improvements, creates a compelling investment thesis for both short-term traders and long-term investors.
The combination of technical signals, fundamental catalysts, and market sentiment indicators suggests that the Ethereum bullish divergence breakout has the potential to achieve its projected targets. However, investors should maintain appropriate risk management practices and continue monitoring market developments that could impact the breakout’s success.