

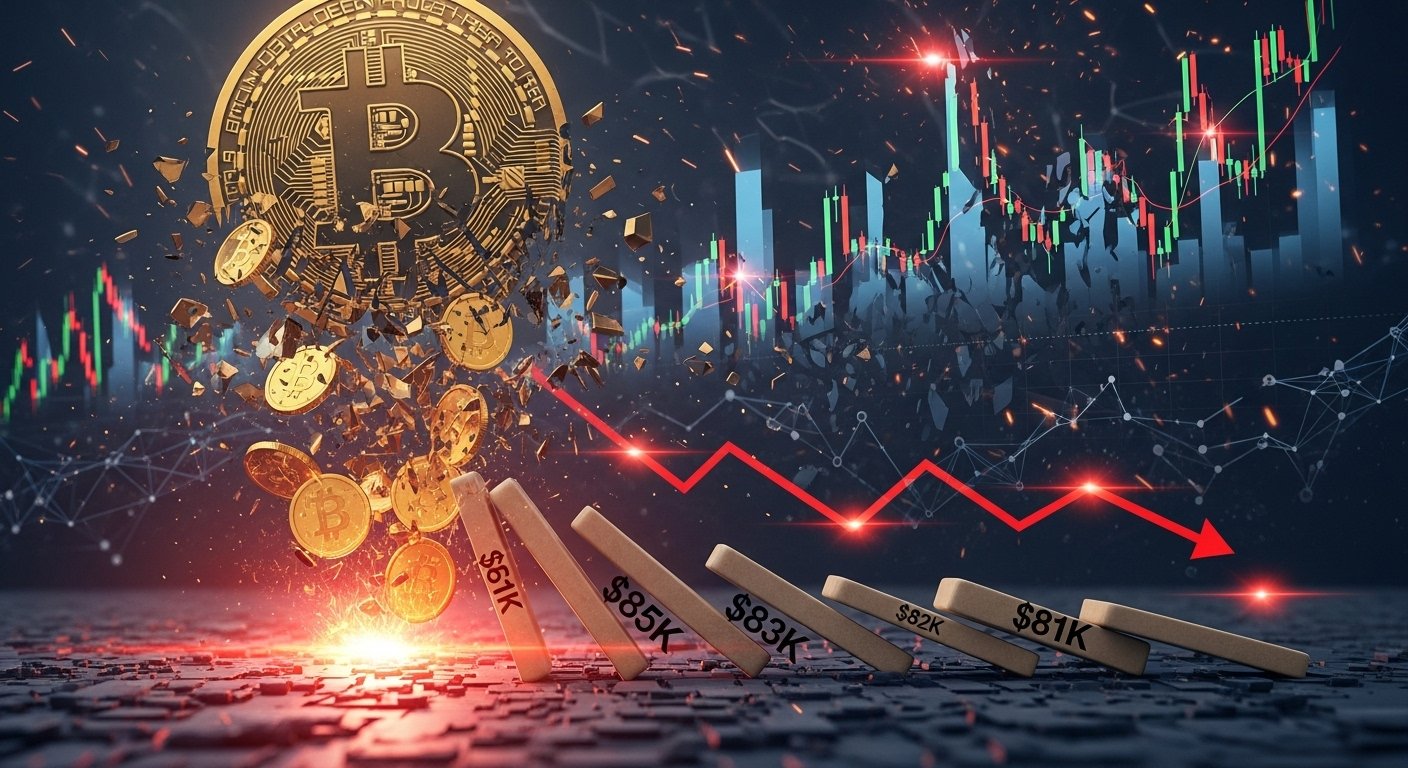
Bitcoin drops to $81K, it’s not just a price update—it’s a stress event that reveals where leverage has piled up, where liquidity is thin, and how quickly sentiment can flip. A fall into the low-$80,000 range feels dramatic because it sits at the intersection of two powerful forces: the psychology of round-number support and the mechanics of modern crypto derivatives. In this kind of move, price doesn’t merely drift lower. It snaps through levels, forces automatic position closures, and turns normal selling into a chain reaction.
That’s why the headline matters: Bitcoin drops to $81K and triggers an estimated $1.7B in liquidations. Liquidations are not the same as investors choosing to sell. They’re often forced, system-driven closures of leveraged positions that can accelerate a drop far beyond what spot selling alone might have done. When many traders are positioned similarly—especially with high leverage—the market becomes fragile. A small push can become a cascade.
This is also why these moments can feel confusing. To some, the move looks like panic. To others, it looks like a routine flush in a highly leveraged ecosystem. The truth is usually both: real selling pressure meets mechanical selling pressure, and the combination becomes powerful. In the hours after a crash, narratives multiply—macro headlines, policy uncertainty, whales, market manipulation—but the most reliable explanation often comes from structure: how much leverage was in the system, where liquidation levels clustered, and how quickly liquidity disappeared as volatility spiked.
In this article, we’ll break down what it really means when Bitcoin drops to $81K, how $1.7B liquidations can happen so fast, which catalysts commonly trigger these moves, and what to watch next if you’re navigating a market where crypto volatility can change the rules in minutes. We’ll keep it practical, readable, and detailed—so you can understand the mechanics without getting lost in jargon.
Why Bitcoin drops to $81K can trigger a liquidation cascade
The phrase Bitcoin drops to $81K sounds like a simple statement, but it often implies something deeper: the market crossed levels where leveraged traders couldn’t survive. Crypto’s derivatives ecosystem allows traders to take large exposure with relatively small collateral, which works well when price moves in their favor. But when the move reverses quickly, the same tool becomes a trap.
At a basic level, a leveraged long position needs enough margin to stay open. As price falls, that margin shrinks. If the account no longer meets the exchange’s requirements, the position is automatically closed. That closure usually happens through market orders, which can push price down further—especially if the order book is thin or market makers widen spreads during turbulence.
This is how a normal dip becomes a waterfall. First, price slips. Then stop-loss orders trigger. Then margin thresholds are breached. Then liquidations begin. And once liquidations begin, the market can enter a feedback loop where each forced closure nudges price lower, triggering more closures. When Bitcoin drops to $81K during heavy leverage, the speed becomes the story.
The hidden fuel: leverage stacked on top of confidence
Leverage doesn’t appear out of nowhere. It typically builds when traders feel confident. That confidence can come from a strong uptrend, bullish narratives, a series of successful dip-buys, or the belief that “support will hold.” Over time, this creates a market structure where many participants place similar bets at similar levels. When that structure breaks, the unwind is violent.
A key point is that liquidation events aren’t only about being “wrong.” You can be directionally right over a longer horizon and still get liquidated in the short term if your leverage is too high or your entry timing is unlucky. When Bitcoin drops to $81K, it punishes fragility, not just bad ideas.
Why liquidations can distort price more than fundamentals
In liquidation-driven drops, price can overshoot. That doesn’t mean Bitcoin’s fundamentals changed overnight. It means the market is temporarily dominated by mechanical flows—automatic closures, forced selling, and defensive de-risking. In these moments, even strong hands can hesitate, because nobody wants to catch a falling knife while liquidation engines are still firing.
Understanding $1.7B liquidations in plain English
When you hear $1.7B liquidations, it’s easy to imagine billions of dollars “lost” in a single pile. In reality, it reflects the notional value of leveraged positions that were forcibly closed across exchanges. It’s a measure of how many positions were wiped out, not necessarily a direct transfer of cash from one group to another. Still, it’s a powerful indicator of market stress and excessive leverage.
Liquidations tend to spike when three conditions align: crowded positioning, a clear break of technical levels, and reduced liquidity. When Bitcoin drops to $81K, all three can appear at once.
Long liquidations versus short liquidations
Most large liquidation events are dominated by long liquidations. That’s because, in bullish environments, traders often lean long. When price reverses sharply, longs are the first to hit liquidation thresholds. Short liquidations can happen too—especially during sharp rebounds—but in a sudden dump, longs typically take the bigger hit.
This matters because it shapes what happens next. If a big portion of longs has been flushed out, the market may temporarily become less leveraged. That can reduce fragility and sometimes allow price to stabilize. In other cases, fear remains high and selling continues, especially if broader conditions are worsening.
Why liquidation cascades accelerate near “obvious” levels
“Obvious” levels—like round numbers or widely watched support zones—attract large clusters of orders. Traders place stops just below these levels. Liquidation thresholds often sit near them too, because many entries and risk assumptions revolve around the same points on the chart. When Bitcoin drops to $81K after breaking a key level, it can trigger a dense cluster of stops and liquidations in a short span.
The result is a drop that feels like a trapdoor: the market looks stable until it isn’t, and then it moves fast.
What likely triggered the drop: catalysts that amplify downside
It’s tempting to hunt for a single cause every time Bitcoin drops to $81K. But markets rarely move on one factor. Usually, it’s a combination of catalyst and positioning. A catalyst provides the spark; leverage provides the fuel.
Macro pressure and shifting risk appetite
Bitcoin often behaves like a risk asset, especially during periods when global markets are sensitive to interest rates, liquidity expectations, or policy uncertainty. When traders anticipate tighter conditions or unexpected policy moves, they reduce exposure to volatile assets first. Crypto can be hit quickly because it trades continuously and reacts instantly.
In these environments, even neutral headlines can create a risk-off shift if the market was already overextended. When Bitcoin drops to $81K, it may reflect a broader move toward caution across multiple asset classes.
Sentiment whiplash and the speed of crypto markets
Crypto’s 24/7 nature can intensify emotional swings. A selloff that begins in one region’s trading hours can accelerate across the globe as liquidity changes and different participants react. Once the move becomes obvious, it draws in momentum sellers and triggers algorithmic strategies designed to cut risk when volatility spikes.
This speed is why the market can go from “buy the dip” to “reduce exposure” rapidly. When Bitcoin drops to $81K, traders who were calm at $86K may become defensive at $83K, especially if they see liquidation numbers rising.
Market structure: thin liquidity at the wrong moment
Liquidity isn’t constant. It changes based on volatility, time of day, and market-maker behavior. When volatility spikes, spreads can widen and order books can thin out. If a wave of market sells arrives during thin liquidity, price can fall more than expected.
This is a key reason why liquidation events can look exaggerated. It’s not always about massive spot selling. It’s about a temporary imbalance where sellers are urgent and buyers are cautious.
Technical levels and market psychology after Bitcoin drops to $81K
Technical analysis doesn’t guarantee outcomes, but it helps explain behavior. When Bitcoin drops to $81K, traders immediately focus on whether the move was a temporary flush or the start of a deeper trend change.
Why round-number zones matter more than people admit
Round numbers like $80K and $85K carry psychological weight. They influence where traders place bids, stops, and take-profit orders. A dip below a round number can trigger fear, while a reclaim can restore confidence quickly.
After a sharp drop, many traders look for a “reclaim” of broken support. If Bitcoin climbs back above a key level and holds it, some interpret the move as a liquidity sweep and a reset. If it fails to reclaim, they interpret it as weakness and sell rallies.
Volatility regimes: the market changes after a liquidation event
A day where Bitcoin drops to $81K can shift the market into a new volatility regime. In higher volatility regimes, price can swing thousands of dollars in hours. This makes it harder to trade with tight stops and encourages more conservative positioning.
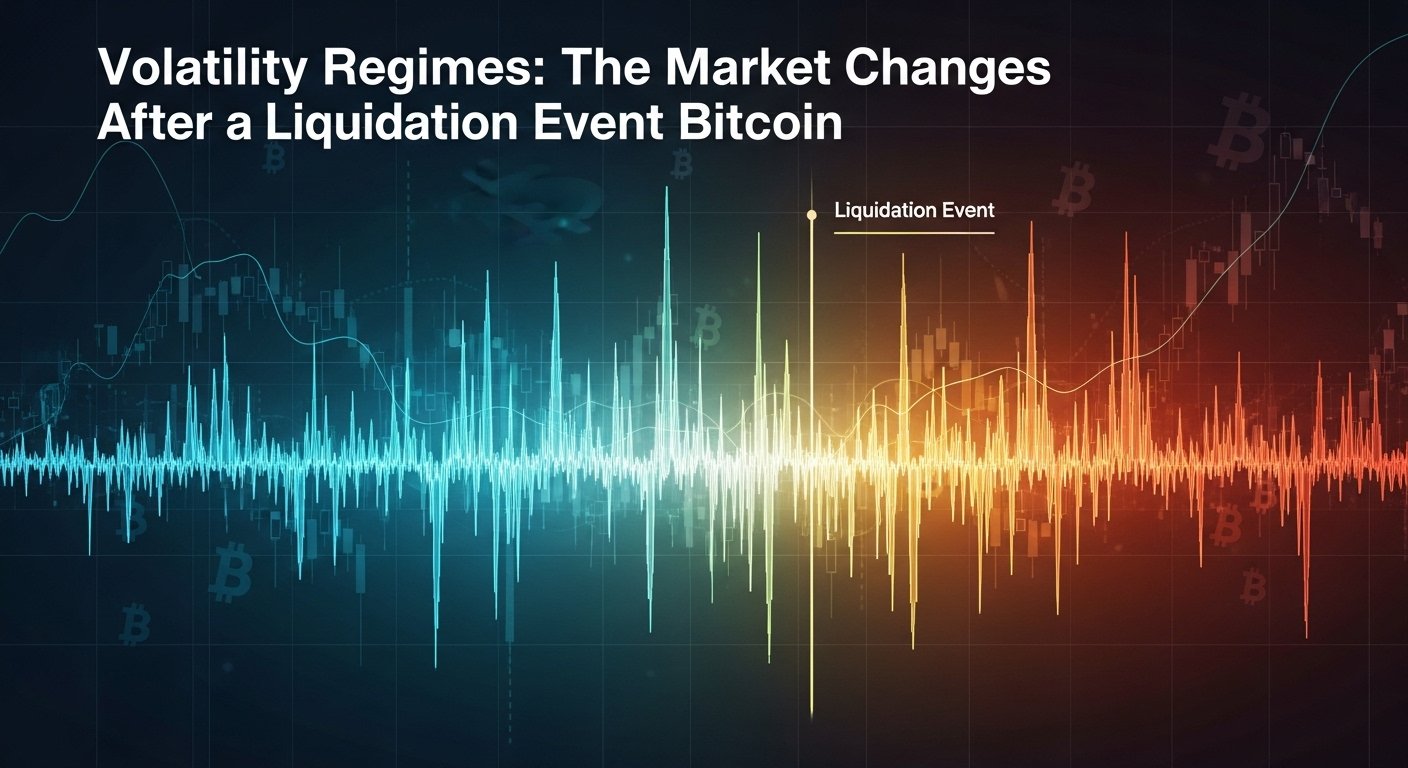
It also changes how narratives spread. In calm markets, people discuss long-term adoption. In volatile markets, people discuss liquidation risk, leverage, and survival. This doesn’t mean long-term fundamentals vanish—it means the short-term battlefield becomes more important.
Why “the bounce” can be just as violent
After a liquidation flush, rebounds can be sharp because the market has already forced out fragile longs. If sellers become exhausted and shorts pile in late, price can snap upward on short covering. In other words, liquidation cascades don’t only create downside risk—they can create short squeeze conditions later, especially if sentiment flips quickly.
Derivatives signals to watch next: funding, open interest, and leverage reset
If you want to understand what happens after Bitcoin drops to $81K, watch derivatives data in concept—even if you don’t trade derivatives. These signals help explain whether the market is stabilizing or reloading leverage for another volatile move.
Funding rates and the cost of being long
Funding rates reflect how positioned the market is. When funding is high, it suggests many traders are long and paying to hold that position. After a crash, funding often cools as leverage unwinds. A healthy stabilization often comes with normalized funding and reduced one-sided positioning.
If funding climbs quickly again after the drop, it may suggest traders are re-entering aggressive longs too soon, increasing fragility.
Open interest: is leverage rebuilding?
Open interest measures how many derivatives positions are open. After a major liquidation event, open interest often drops as positions are closed. If open interest rebuilds rapidly while price remains choppy, it can signal renewed leverage—meaning another cascade is possible if price breaks a key level again.
A slower rebuild can indicate caution and may reduce the odds of another sudden liquidation wave.
Spot versus derivatives leadership
One of the biggest questions is whether spot demand returns. If spot buyers step in and absorb selling, price can stabilize. If derivatives lead every move and spot remains hesitant, the market can remain unstable longer. When Bitcoin drops to $81K, the recovery quality often depends on whether real demand returns or whether the market is only bouncing on leverage.
How the crash affects altcoins and the wider crypto ecosystem
When Bitcoin drops to $81K, it rarely stays contained. Bitcoin is the anchor of crypto market structure. Altcoins often move with higher beta, meaning they can fall harder during risk-off moves and rise faster during relief rallies.
Correlation spikes: why “good projects” still drop
In panics, correlations often rise. Traders sell what they can, not what they want. If positions are losing and collateral is shrinking, participants sell liquid assets quickly to raise margin. That can hit majors and high-volume altcoins alike.
This can feel unfair to long-term builders, but it’s a normal feature of leveraged markets. During liquidation events, the market behaves less like a set of independent projects and more like one interconnected risk complex.
Rotation and narrative shifts after a big drawdown
A sharp event like Bitcoin drops to $81K often reshapes what narratives dominate. Traders shift from growth stories to safety, from speculative plays to more established assets, and from “maximum risk” to “controlled risk.” Some segments recover faster, while others remain suppressed if liquidity has been damaged.
Practical risk thinking: what traders and investors can learn
A liquidation-driven crash can be painful, but it’s also instructive. When Bitcoin drops to $81K and wipes out huge leveraged exposure, it highlights principles that matter regardless of your strategy.
Position sizing beats prediction
You don’t need to predict every move if your exposure is sized to survive volatility. Many blowups come from being too large relative to account size, not from having a bad idea. In crypto, sudden volatility can be normal, which means survival needs to be built into the plan.
Leverage isn’t “bad,” but it’s rarely forgiving
Leverage can be useful for hedging or tactical moves, but it magnifies timing risk. In markets where crypto volatility can spike suddenly, high leverage turns normal drawdowns into liquidation risk. The market doesn’t need to go to zero to wipe you out; it only needs to move far enough, fast enough.
Long-term investors: avoid turning volatility into a forced decision
If you’re investing rather than trading, the biggest danger is being forced to act at the worst time—through margin, panic, or lack of a plan. A long-term approach often focuses on time horizon, diversification, and avoiding leverage that can turn a temporary drop into permanent loss.
When Bitcoin drops to $81K, a prepared investor asks: “Has my thesis changed?” A fragile investor asks: “How do I stop the pain?” The difference is planning.
What happens next: realistic scenarios after Bitcoin drops to $81K
No single article can promise the next candle. But we can map plausible scenarios based on how liquidation events usually evolve.
Scenario one: stabilization and a controlled recovery
If the market treats the move as a leverage flush, Bitcoin may stabilize, reclaim key levels, and grind upward as confidence returns. This tends to happen when selling pressure fades, leverage remains lower, and spot demand grows steadily.
In this scenario, the crash becomes a reset rather than a collapse—painful, but structurally healthy.
Scenario two: choppy range and repeated shakeouts
Sometimes the aftermath is messy. Price bounces, fails, dips again, and punishes both bulls and bears. This happens when uncertainty remains high and traders keep rebuilding leverage too quickly.
In this environment, patience often outperforms intensity. Overtrading can turn volatility into a series of avoidable losses.
Scenario three: deeper downside if macro conditions worsen
If broader conditions keep deteriorating and risk appetite stays weak, the market can continue lower. In that case, rallies may be sold, and confidence may take longer to rebuild. A major liquidation event doesn’t guarantee the bottom—it only guarantees that a lot of leverage has been cleared out.
Conclusion
When Bitcoin drops to $81K and triggers $1.7B liquidations, the headline feels like chaos, but the mechanics are consistent. Leverage built up. Price broke key levels. Forced closures amplified the decline. Liquidity thinned. The market moved faster than most humans can react.
The lesson isn’t that Bitcoin is “broken.” The lesson is that leverage makes the market brittle, and brittleness creates cascades. If you trade, respect margin and volatility. If you invest, separate short-term liquidation drama from long-term conviction, and avoid strategies that force you to sell at the worst time. The most important question now isn’t what happened—it’s what happens after the flush: whether demand returns, whether leverage stays reduced, and whether confidence can rebuild without turning into overconfidence again.
FAQs
Q: Why did Bitcoin drops to $81K trigger so many liquidations?
Because many traders were using leverage, and the move below key levels caused automated liquidation engines to close positions. Those forced closures created additional sell pressure, accelerating the drop.
Q: What does $1.7B liquidations actually mean?
It generally refers to the notional value of leveraged positions that were forcibly closed across exchanges. It signals heavy leverage and market stress, not necessarily a single “cash loss” pile.
Q: Is a liquidation cascade bearish for the long term?
Not always. Liquidation cascades can act like a leverage reset, which sometimes helps the market stabilize. Long-term impact depends on whether broader conditions improve and whether spot demand returns.
Q: Can Bitcoin recover quickly after dropping to $81K?
Yes, sharp rebounds can happen after a flush, especially if selling exhausts and shorts pile in late. However, quick recovery is more likely when leverage stays lower and buyers step in consistently.
Q: What should I watch next after Bitcoin drops to $81K?
Pay attention to market behavior around key reclaim levels, the intensity of volatility, and whether the market looks structurally calmer. If leverage rebuilds too fast, instability can return; if demand grows steadily, a stronger base can form.
See More: Bitcoin Derivatives Warn OI Drops Liquidations Jump