

As Bitcoin volatility spikes and the price inches closer to the $92,800 resistance level, traders and investors are once again on high alert. Bitcoin has a long history of explosive moves when it approaches major resistance zones, and this time is no different. The combination of intense market speculation, heavy derivatives activity, and shifting on-chain metrics is creating a highly charged environment where both opportunity and risk are elevated.
This zone around $92,800 is more than just a number on the chart. It represents a psychologically important level where many participants are deciding whether to take profits, enter fresh long positions, or even bet against the market. As a result, liquidity is concentrated, order books are stacked, and price action has become increasingly erratic. Sudden wicks, rapid reversals, and sharp breakouts are all signs that Bitcoin price volatility is reaching a critical point.
In this article, we will break down why Bitcoin volatility spikes as price nears $92,800 resistance, what it means for short-term traders and long-term holders, and how to navigate this phase with a clear, informed strategy. We will explore technical analysis, market sentiment, institutional flows, and risk management so you can better understand what might come next for the world’s leading cryptocurrency.
Why Bitcoin Volatility Spikes Near Key Resistance Levels
When Bitcoin approaches a strong resistance level like $92,800, volatility often increases because the market is forced to make a decision. At these levels, there is usually a heavy cluster of sell orders, stop losses, and liquidation points, all of which can trigger sudden and dramatic moves.
From a technical analysis standpoint, resistance zones are areas where price has previously struggled to break through. Traders who bought lower may see the approaching level as a chance to lock in profits, while short sellers might view it as a high-probability entry for a reversal. This tug-of-war between buyers and sellers naturally leads to expanded ranges and rapid price swings.
At the same time, leveraged positions on futures and perpetual swaps tend to pile up near such key levels. When the price moves strongly in one direction, overleveraged traders can be liquidated, which adds further momentum to the move and amplifies Bitcoin volatility even more. This feedback loop is one of the main reasons why the market becomes so unpredictable when a major resistance level is in play.
The Significance of the $92,800 Resistance Zone
The $92,800 resistance is not just a random point; it is a level that traders watch closely because it can act as a gateway to a new price range. Once Bitcoin decisively breaks above a strong resistance area, it often enters what many call “price discovery,” where historical reference points are limited and moves can become fast and aggressive. This level is significant for several reasons:
Historical Supply and Profit-Taking
Many traders who entered earlier rallies may have set take-profit orders close to the $92,800 mark. As the price approaches this level, these orders begin to trigger, injecting sell pressure into the market. This can temporarily halt the rally, create sharp pullbacks, or force Bitcoin into a period of consolidation just below resistance. Because Bitcoin volatility spikes as price nears $92,800 resistance, even a small shift in order flow can lead to large candles and intraday reversals. Short-term traders often try to exploit this by scalping the range, entering quick trades based on reaction at the level.
Psychological Impact on Traders
Round or notable price levels have a strong psychological effect on market participants. Even if $92,800 is not a perfectly round number like $90,000 or $100,000, it still stands out as a key technical area. The closer Bitcoin gets to this zone, the more attention it receives on social media, in trading communities, and in crypto news outlets. This increased attention tends to attract new traders, including retail investors who may be driven by FOMO (fear of missing out). As more participants enter the market without a clear plan, intraday volatility can intensify, further contributing to the chaotic price behavior observed near resistance.
Technical Indicators Confirm Rising Bitcoin Volatility
To understand why Bitcoin volatility spikes as price nears $92,800 resistance, it is helpful to look at some key technical indicators that traders use to gauge market conditions.
Bollinger Bands and Expanding Price Ranges
One widely used volatility indicator is Bollinger Bands, which expand and contract based on price deviation from the moving average. When Bitcoin approaches the resistance area and the bands start to widen, it is a clear sign that volatility is increasing. Large candles that touch or break outside the bands often indicate aggressive buying or selling pressure.
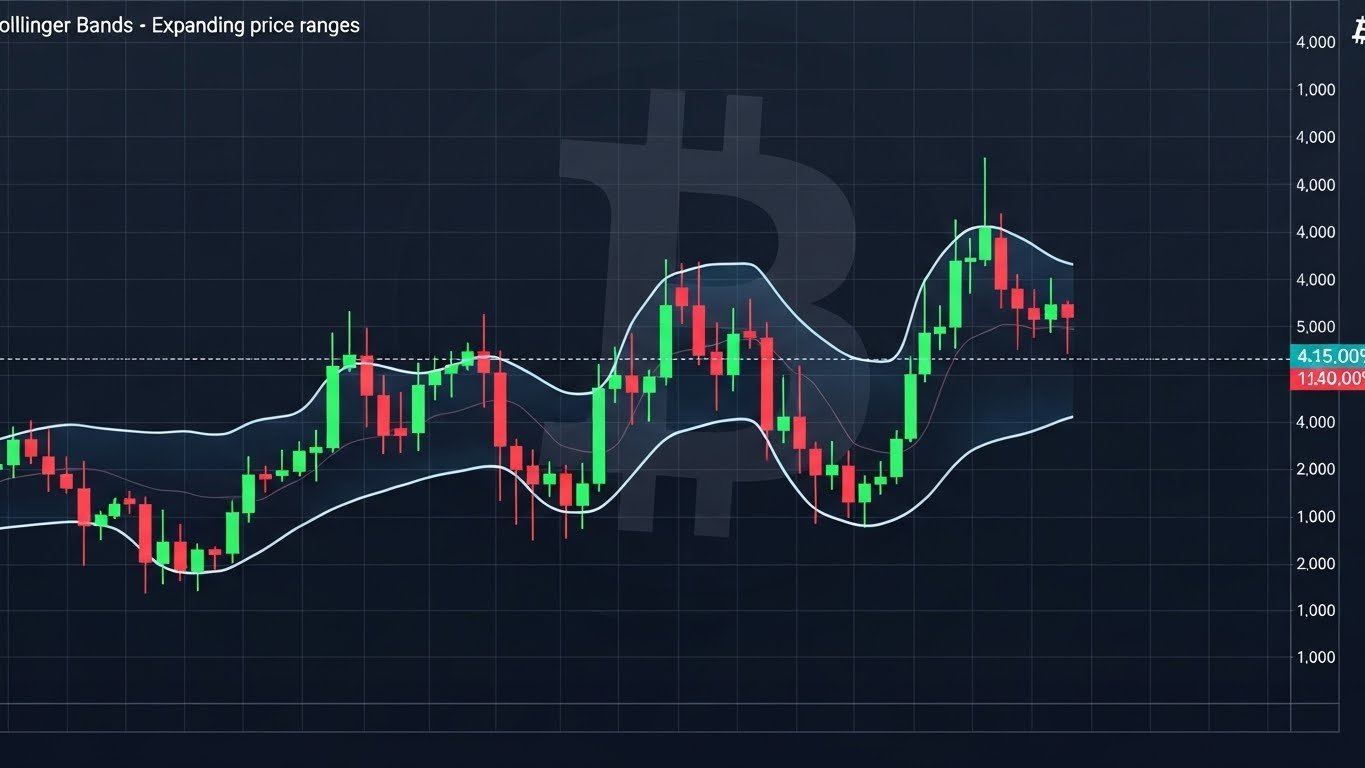
An expanding band structure around the $92,800 level suggests that the market is entering a more unstable phase, where quick breaks and sudden reversals become common. Traders should be especially cautious when price hugs the upper band near resistance, as this can either precede a breakout or a sharp correction.
Relative Strength Index and Overbought Signals
The Relative Strength Index (RSI) is another popular tool for assessing whether Bitcoin is overbought or oversold. As the price approaches $92,800, the RSI often climbs into higher regions, reflecting strong upside momentum. However, when it reaches extreme levels, such as above 70, traders begin to anticipate a potential pullback. This interplay between momentum and exhaustion is a critical factor in understanding why volatility spikes at resistance. If the RSI stays elevated while Bitcoin consolidates just below $92,800, it can create conditions for a volatile breakout. On the other hand, a sharp RSI downturn from overbought levels can coincide with a steep correction.
On-Chain Metrics and Market Structure
Beyond price charts, on-chain data offers a deeper insight into how market participants are behaving as Bitcoin nears the $92,800 resistance. Metrics like realized price, whale activity, and exchange inflows can signal whether the market is preparing for a breakout or bracing for a sell-off.
Whale Movements and Large Transactions
When large holders (whales) move significant amounts of Bitcoin, it can have a noticeable impact on price. Increased whale activity as the market approaches $92,800 may suggest that big players are repositioning. If whales send coins to exchanges, it could indicate impending profit-taking, which adds sell pressure at resistance.
Conversely, if they withdraw Bitcoin from exchanges to cold wallets, it can be a sign of long-term accumulation and confidence in further upside. These big-money moves can either dampen or amplify Bitcoin volatility, depending on their direction and timing. Traders monitoring whale wallets, exchange balances, and other on-chain signals can often anticipate heightened volatility in advance.
Exchange Inflows, Outflows, and Liquidity
Another important on-chain factor is the amount of Bitcoin moving into and out of exchanges. Elevated exchange inflows near $92,800 suggest that more holders are ready to sell, potentially reinforcing the resistance level. In contrast, increasing outflows indicate that coins are being removed from liquid markets, which can tighten supply and make breakouts more explosive. When liquidity thins out just above or below resistance, even relatively small buy or sell orders can cause large price swings, contributing to the perception that Bitcoin volatility spikes as price nears $92,800 resistance.
Derivatives, Funding Rates, and Liquidations
The derivatives market plays a massive role in shaping Bitcoin’s short-term price behavior. As price edges closer to $92,800, open interest in futures and perpetual swaps often surges. This means more traders are taking leveraged positions based on their expectations of a breakout or rejection.
Funding Rates and Market Bias
Funding rates show whether long or short positions are paying a fee to hold their positions. When funding becomes strongly positive near resistance, it indicates that long positions are dominant and traders are heavily betting on further upside. This can create a vulnerable environment where any sudden move down triggers long liquidations, accelerating the drop.
Similarly, if funding turns negative as Bitcoin approaches $92,800, it suggests that shorts are piling in, expecting a rejection. In this scenario, a sharp upward move can squeeze these short positions, forcing them to buy back into the market and pushing price even higher in a short squeeze event.
Liquidation Cascades and Sharp Price Moves
Liquidation events often occur when Bitcoin volatility spikes near resistance. If too many traders are positioned on the same side of the market with high leverage, a relatively small move against them can trigger automatic liquidations. These liquidations add fuel to the move, causing a chain reaction that can drive price dramatically in a short period. This is one reason why candles near $92,800 can be extremely large compared to quieter periods. Traders who are not prepared for these sudden shifts may find themselves stopped out or forced to exit positions at unfavorable levels.
How Traders Are Responding to the $92,800 Level
The way traders respond to $92,800 resistance depends largely on their time horizon, risk tolerance, and trading style. However, certain patterns tend to emerge whenever Bitcoin volatility spikes near such a key technical level.
Short-Term Traders and Intraday Strategies
Short-term and intraday traders often thrive in highly volatile conditions. When Bitcoin approaches $92,800, many will look to trade the range, buying support levels just below resistance and selling into quick spikes. Others may try to fade the move, shorting near resistance with tight stops in anticipation of a rejection. Because the order flow is dense around this level, short-term traders rely heavily on tools like order book heatmaps, volume profiles, and candlestick patterns to make quick decisions. They accept that volatility can be both a friend and an enemy, offering rapid profits but also rapid losses.