

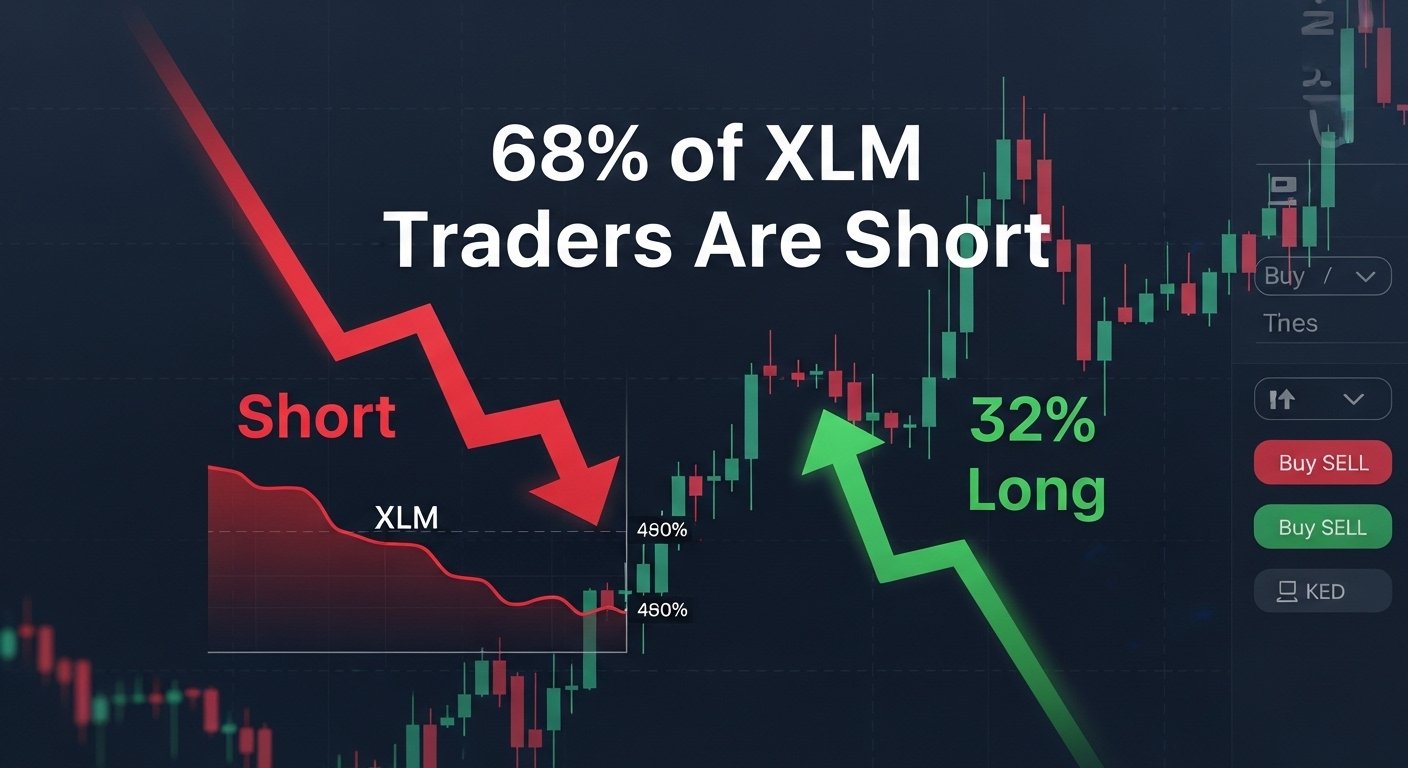
XLM Traders Short 68% market positioning gets lopsided, price action often becomes less about “what should happen” and more about “what must happen” for traders to survive. Right now, the headline number grabbing attention is that 68% of XLM traders are short, a signal that bearish positioning has become crowded and sentiment is leaning heavily negative.
In crypto, crowded positioning is a double-edged sword. On one hand, it can reflect legitimate weakness: fading momentum, broken support, and traders leaning into the downtrend. On the other hand, it can create the conditions for abrupt upside spikes—especially when a coin like XLM starts showing quiet but persistent accumulation. When shorts dominate and buyers steadily absorb sell pressure, it can build a spring-loaded setup where a relatively small push upward forces short sellers to buy back, fueling a rebound.
XLM in Context: Why This Asset Still Attracts Traders
Before diving into positioning, it helps to remember what XLM represents. XLM is the native token (lumen) of the Stellar network, designed to support fast, low-cost transfers and to play a functional role inside the network (including minimum balance requirements and transaction mechanics). The Stellar protocol dates back to 2014, and XLM has long been viewed as a payments-focused crypto asset with deep exchange liquidity and a strong retail following.
That combination—high liquidity, widespread availability, and a history of sharp trend cycles—makes XLM a magnet for derivatives traders. It also means the market frequently swings between emotional extremes: euphoric rallies that attract late longs, followed by drawdowns that encourage aggressive shorts. So when you see “XLM traders short” dominating the tape, the most important question isn’t whether the crowd is bearish. The question is: are bears early—or already late?
What “68% of XLM Traders Are Short” Actually Means
The phrase “68% of XLM traders are short” is powerful, but it’s only useful if you understand what’s being measured. On many exchanges and data aggregators, this figure usually refers to the percentage of accounts that are net short during a given window (often 4 hours, 24 hours, or another defined timeframe).
A key point: these are typically accounts ratios, not necessarily raw contract size. One whale short can outweigh thousands of small long accounts, and different platforms publish different flavors of the metric. Still, if a large majority of traders are short, it usually implies at least three things are happening simultaneously:
First, sentiment is risk-off and traders expect further downside in XLM. Second, the market is increasingly sensitive to upside surprises, because short sellers have defined risk points where they must exit. Third, the probability of a volatility spike rises, because crowded trades tend to unwind violently when the narrative changes.
How the Long/Short Ratio Is Calculated
To interpret “XLM traders short” correctly, it helps to understand the mechanics. Data providers often describe the long/short accounts ratio as the proportion of net long accounts versus net short accounts among users holding positions, with each account counted once. In practical terms, if more accounts are net short, the long/short ratio drops; if more accounts are net long, the ratio rises.
If 68% of XLM traders are short, a simplified mental model is that the account-based long/short ratio would sit well below 1.0, reflecting short dominance. That doesn’t guarantee a reversal—but it does tell you the trade is crowded enough that a shift in price direction can trigger forced buying.
Why Crowded Shorts Can Become Fuel for a Reversal
When XLM traders are short in overwhelming numbers, the market’s structure changes. Downside can become “sticky” if sellers are exhausted and buyers begin absorbing supply, but upside can become explosive because short sellers have a built-in demand trigger: stop losses and margin pressure.
This is why some of the most violent rallies in crypto begin in environments where sentiment is terrible. A reversal doesn’t require everyone to turn bullish. It only requires price to move up far enough that shorts begin covering, and that new spot buyers step in to support the move.
The Short Squeeze Mechanism in Plain English
A short seller borrows or synthetically sells an asset expecting it to fall. If it rises instead, the short is losing money. As XLM rises, more shorts get uncomfortable; some close early. If the move accelerates, liquidations can occur, forcing the exchange to buy XLM on the market to close the position. That buying pushes price even higher, triggering more covers and more liquidations.
So yes—when XLM traders are short at extreme levels, the market can rally simply because it becomes mechanically forced to rally, even if the broader narrative hasn’t improved yet.
Accumulation: The Quiet Counter-Signal Bears Hate
Crowded shorts alone aren’t enough. Shorts can be “right” for a long time in a strong downtrend. The ingredient that makes the reversal thesis credible is accumulation, meaning consistent buying that absorbs sell pressure over time.
Accumulation can show up in different places: spot exchange flows (coins leaving exchanges), wallet cohort growth, improving demand around a key support zone, or even subtle changes in derivatives behavior where aggressive selling stops pushing price lower. Some recent market coverage has emphasized that even when XLM is under pressure, accumulation signals can hint at a potential reversal if key support zones hold.
On-Chain vs. “Market Structure” Accumulation
On-chain accumulation focuses on wallet behavior—who is holding, who is adding, and whether coins are moving to long-term custody. Market-structure accumulation focuses on price behavior—whether XLM stops making lower lows even as negative sentiment persists.
You don’t need perfect on-chain data to recognize accumulation in price. If XLM keeps dipping into a zone and bouncing faster each time, while volume shifts from panic selling to steadier two-way trade, that can indicate buyers are willing to defend a level.
Derivatives Signals That Confirm (or Reject) the Reversal Setup
Because the headline is about XLM traders short, you should watch derivatives indicators closely. The most useful trio is funding rates, open interest, and liquidations—and how they interact when price approaches support or resistance.
CoinGlass and similar platforms track XLM derivatives metrics like long/short ratios, funding rates, open interest, and liquidations. These indicators help answer one question: are shorts building positions confidently—or are they becoming vulnerable?
Funding Rates: Are Shorts Getting Paid to Stay Short?
In perpetual futures, funding rates represent a periodic payment between longs and shorts. When funding is negative, shorts typically receive payments from longs; when funding is positive, longs pay shorts. This matters because it reveals crowd behavior and leverage preferences.
If XLM traders are short and funding is deeply negative, shorts may feel comfortable holding positions, and the downtrend can persist. But if price stops falling while funding stays negative, it can suggest shorts are paying attention to “free yield” rather than price risk, which can become dangerous if XLM suddenly pops.
Open Interest: Is Leverage Expanding Into the Move?
Open interest rising while XLM falls can indicate new short positions are being added, which increases squeeze potential later. Open interest falling while XLM falls can indicate capitulation—positions closing, which may reduce squeeze fuel but can also signal a bottoming process if selling is exhausted.
For reversal setups, traders often prefer to see open interest remain elevated (meaning fuel is still there), but price begins stabilizing (meaning shorts are no longer in control of direction).
Liquidations: The Spark That Turns a Bounce Into a Run
Liquidation clusters often form above recent highs and around obvious technical levels. If XLM trades sideways under resistance while XLM traders short remain crowded, a breakout can cascade quickly. That’s why a “small” breakout level can matter so much: it’s not just a chart line, it’s a trigger for forced buying.
Technical Structure: Where a Reversal Would Likely Start
A reversal narrative becomes tradable when you can define invalidation and targets. If you can’t answer “where am I wrong?” you’re not analyzing—you’re hoping.
Even though exact levels change with market conditions, XLM reversals often hinge on three technical ideas: reclaiming broken support, flipping resistance into support, and holding higher lows.
The Support Zone Problem: Bears Need a Breakdown, Bulls Need a Hold
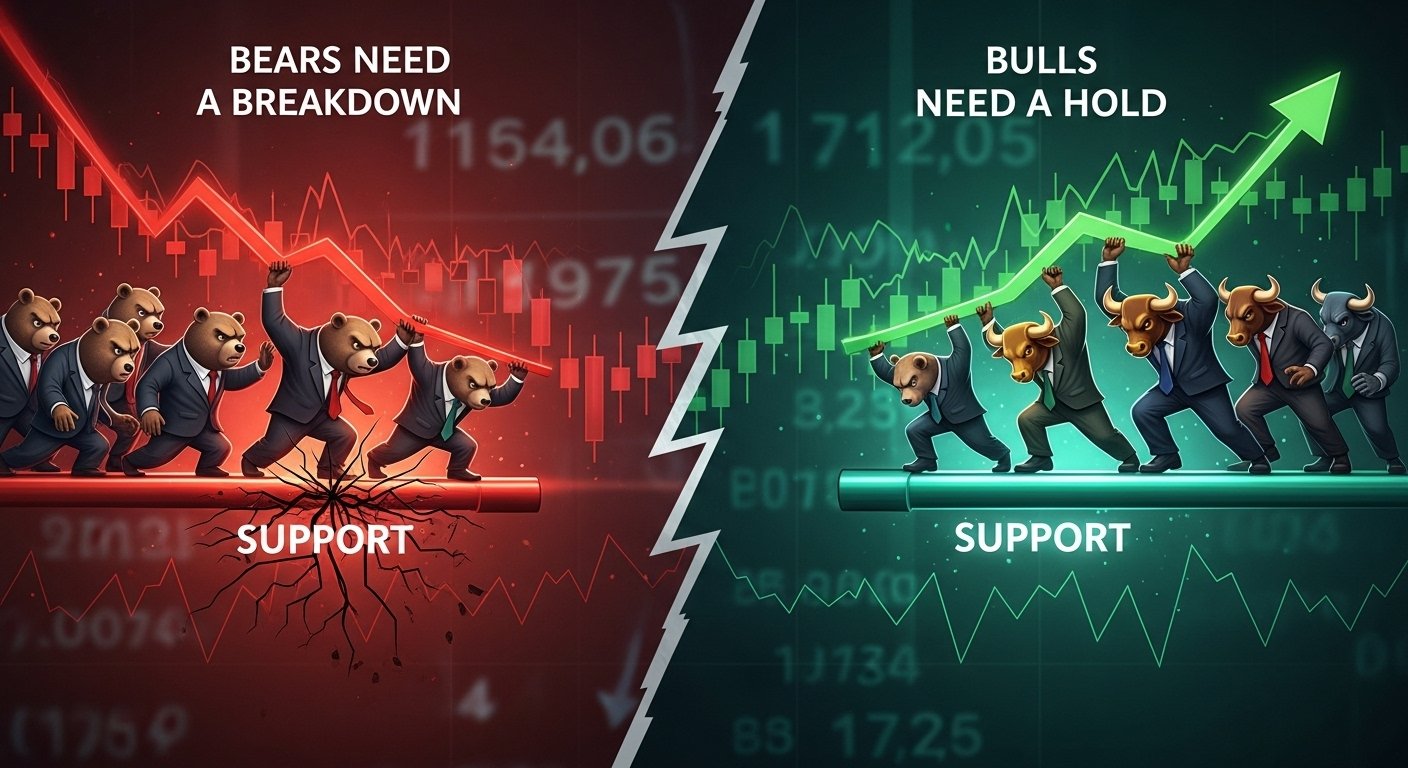
Most crowded-short environments are fragile around major support zones. If XLM breaks down decisively and closes below support with expanding volume, then “XLM traders short” dominance is simply confirmation of a continuing trend. But if XLM repeatedly tests a zone and fails to break lower, the short thesis weakens. That’s where accumulation becomes visible: buyers show up repeatedly, not with hype, but with consistency.
Reclaiming Moving Averages and Trendlines
One of the cleanest reversal confirmations is when XLM stops trading below key averages and begins reclaiming them. A move above commonly watched levels can shift psychology quickly: shorts stop adding, longs stop hesitating, and neutral traders re-enter.
It’s less about which moving average you choose and more about the market’s reaction: does reclaimed structure hold on a retest? If it does, the reversal is no longer just theoretical.
Fundamental Narrative: Why XLM Still Gets “Second Chances”
A technical reversal is easier when the asset has a narrative tailwind. XLM’s narrative isn’t about meme energy—it’s about utility in payments and cross-border transfer infrastructure within the Stellar ecosystem. The lumen’s functional role in the Stellar network is part of why XLM remains relevant across cycles.
That doesn’t mean fundamentals drive week-to-week price. But fundamentals often determine whether dips become long-term accumulation opportunities or whether they become slow fades into irrelevance. XLM has historically avoided the second outcome, largely because it remains integrated into a broader ecosystem and is widely traded.
A Practical “Reversal Checklist” for This Setup
If you’re trying to trade the idea that XLM traders are short and accumulation could trigger a reversal, you should focus on confirmation rather than prediction. The market can stay irrational longer than a leveraged trader can stay solvent.
A more grounded approach is to watch whether the short crowd is losing control. Signs include: price stabilizing despite bearish positioning, funding rates failing to push price lower, and a breakout that holds on retest. If those appear together, the probability of a sustained reversal improves.
Just as importantly, you want to see that any rally isn’t instantly rejected. A single green candle doesn’t invalidate a downtrend. Structure does.
Risk Factors: Why This Can Fail Even With 68% Shorts
The most common mistake in contrarian analysis is assuming “crowded” means “wrong.” Sometimes, XLM traders short are crowded because the trend is legitimately broken and liquidity is thin on the bid. In that case, shorts can remain in control, price can grind down, and occasional bounces become sell opportunities.
A reversal can also fail if accumulation is weak—meaning buyers don’t actually step up when price breaks resistance, or spot volume doesn’t support the move. In that scenario, shorts cover briefly, price spikes, and then sellers return with more confidence.
Finally, broader market conditions matter. XLM rarely moves in isolation for long. If the wider crypto market turns risk-off aggressively, XLM can struggle to sustain a reversal even if its own positioning looks ripe for it.
Conclusion
The fact that 68% of XLM traders are short tells you something important: bearish positioning is crowded and the market is vulnerable to upside shocks. But a reversal isn’t guaranteed just because traders are leaning one way. What turns a crowded short into a meaningful rally is accumulation plus confirmation—price stabilizing at support, derivatives signals shifting, and structure reclaiming key levels.
If accumulation continues while shorts remain dominant, XLM can snap higher quickly—sometimes faster than most traders expect. But if support breaks and buyers disappear, then the short crowd may simply be aligned with the trend. In other words, the setup is compelling, but the market still demands proof.
What to do next isn’t about being bullish or bearish—it’s about being precise: define the level that invalidates the reversal thesis, watch the derivatives data for stress, and respect that XLM can move violently in either direction when positioning becomes extreme.
FAQs
Q: Is it bullish when XLM traders are short in large numbers?
It can be bullish only in a contrarian sense. When XLM traders are short at extreme levels, the market can become vulnerable to short covering and liquidations if price rises. But it’s not automatically bullish—trend structure and demand still matter.
Q: What is the long/short ratio and why does it matter for XLM?
The long/short ratio compares how many accounts (or positions, depending on the source) are net long versus net short. If the ratio drops below 1, shorts dominate; above 1, longs dominate. Many platforms define it as an accounts-based measure of net positioning.
Q: What is accumulation and how can I spot it in XLM?
Accumulation is consistent buying that absorbs sell pressure over time. You can spot it when XLM stops making lower lows despite bearish sentiment, when support holds repeatedly, or when broader signals suggest buyers are quietly stepping in even as headlines remain negative.
Q: Do funding rates predict whether XLM will reverse?
Funding rates don’t predict reversals by themselves, but they show where leverage is leaning. If XLM traders are short and funding stays negative while price stops falling, it can hint that shorts are becoming crowded and vulnerable to a rebound.
Q: What’s the biggest risk in trading a reversal when XLM traders are short?
The biggest risk is assuming the crowd must be wrong. Shorts can stay in control if the downtrend is strong, support breaks, or spot demand is weak. The safer approach is waiting for confirmation—especially a breakout that holds and doesn’t immediately get sold down.
Also More: XLM Price Surge Analyzing the Potential 88% Breakout